[12] Spatial assessment of maize physical drought vulnerability in sub-Saharan Africa: Linking drought exposure with crop failure
Abstract
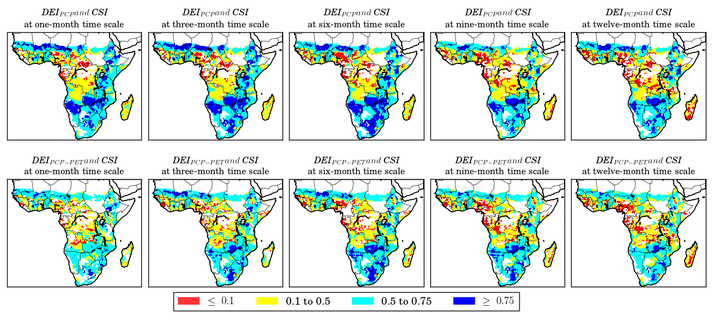
Crop yields exhibit known responses to droughts. However, quantifying crop drought vulnerability is often not straightforward, because components of vulnerability are not defined in a standardized and spatially comparable quantity in most cases and it must be defined on a fine spatial resolution. This study aims to develop a physical crop drought vulnerability index through linking the drought exposure index (DEI) with the crop sensitivity index (CSI) in sub-Saharan Africa. Two different DEIs were compared. One was derived from the cumulative distribution functions fitted to precipitation and the other from the difference between precipitation and potential evapotranspiration. DEIs were calculated for one, three, six, nine, and twelve-month time scales. Similarly, CSI was calculated by fitting a cumulative distribution function to maize yield simulated using the Environmental Policy Integrated Climate model. Using a power function, curves were fitted to CSI and DEI relations resulting in different shapes explaining the severity of vulnerability. The results indicated that the highest correlation was found between CSI and DEI obtained from the difference between precipitation and potential evapotranspiration in one, three, and six-month time scales. Our findings show that southern African countries and some regions of the Sahelian strip are highly vulnerable to drought due to experiencing more water stress, whereas vulnerability in Central African countries pertains to temperature stresses. The proposed methodology provides complementary information on quantifying different degrees of vulnerabilities and the underlying reasons. The methodology can be applied to different regions and spatial scales.